Flexible Tables With Papaja in Rmarkdown

Papaja is an excellent R package that enables reproducible academic manuscripts created in R Markdown (where R code and prose are fused in one place) to align with APA formatting requirements. This is very useful as it ensures the LaTeX version of the manuscript automatically generated after knitting the R Markdown document can be used for submission to academic journals that demand APA formatting.
The official Papaja guide gives instruction on how to use Papaja within R Markdown. If followed, researchers should quite easily be able to create APA formatted manuscripts that automatically update given prior dependent code changes.
Nevertheless, I stumbled upon an alternative method to creating an APA formatted table with Papaja that wasn’t specified in the formal guide, and which some may find useful in light of its flexible nature. I provide a walkthrough of this alternative method here.
The table I will show you how to create has one header row for the column names, and one left-oriented column for the row names. This table type is arguably the most common in academic manuscripts, often being used to display descriptive data and/or correlations amongst study variables. See below for an example of this table from my own research.
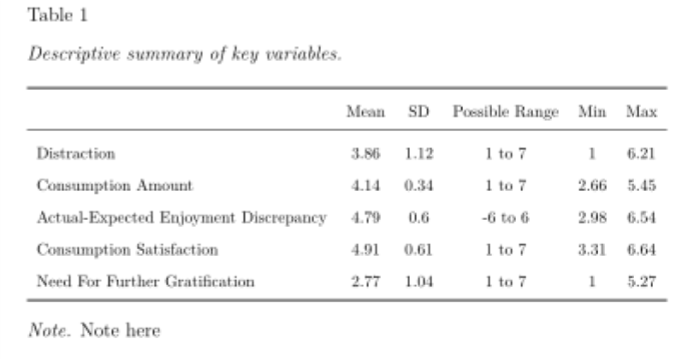
Your first step to creating a table like this in your reproducible manuscript is to ensure the data that will update within your table (given prior dependent code changes) is saved as an R object. In the table above the data expected to update are those in the ‘Mean’, ‘SD’, ‘Min’, and ‘Max’ columns (the ‘Possible Range’ column specifies the possible Likert scale range of each variable), for any changes in the participant inclusion criteria, how the variables are calculated, etc, should lead to changes in variable mean, SD, etc. Thus, I saved these data as R objects.
datMeans <- data.frame(aggregate(Distract1 ~ PID, dat, mean))
Distract1Mean <- round(mean(datMeans$Distract1), digits = 2)
Distract1SD <- round(sd(datMeans$Distract1, na.rm = FALSE), digits = 2)
Distract1min <- round(min(datMeans$Distract1, na.rm = FALSE), digits = 2)
Distract1max <- round(max(datMeans$Distract1, na.rm = FALSE), digits = 2)

datMeans <- data.frame(aggregate(ActCon ~ PID, dat, mean))
ActConMean <- round(mean(datMeans$ActCon), digits = 2)
ActConSD <- round(sd(datMeans$ActCon, na.rm = FALSE), digits = 2)
ActConmin <- round(min(datMeans$ActCon, na.rm = FALSE), digits = 2)
ActConmax <- round(max(datMeans$ActCon, na.rm = FALSE), digits = 2)

datMeans <- data.frame(aggregate(ActEnj ~ PID, dat, mean))
ActEnjMean <- round(mean(datMeans$ActEnj), digits = 2)
ActEnjSD <- round(sd(datMeans$ActEnj, na.rm = FALSE), digits = 2)
ActEnjmin <- round(min(datMeans$ActEnj, na.rm = FALSE), digits = 2)
ActEnjmax <- round(max(datMeans$ActEnj, na.rm = FALSE), digits = 2)

datMeans <- data.frame(aggregate(Satisfied ~ PID, dat, mean))
SatisfiedMean <- round(mean(datMeans$Satisfied), digits = 2)
SatisfiedSD <- round(sd(datMeans$Satisfied, na.rm = FALSE), digits = 2)
Satisfiedmin <- round(min(datMeans$Satisfied, na.rm = FALSE), digits = 2)
Satisfiedmax <- round(max(datMeans$Satisfied, na.rm = FALSE), digits = 2)

datMeans <- data.frame(aggregate(MoreGrati ~ PID, dat, mean))
MoreGratiMean <- round(mean(datMeans$MoreGrati), digits = 2)
MoreGratiSD <- round(sd(datMeans$MoreGrati, na.rm = FALSE), digits = 2)
MoreGratimin <- round(min(datMeans$MoreGrati, na.rm = FALSE), digits = 2)
MoreGratimax <- round(max(datMeans$MoreGrati, na.rm = FALSE), digits = 2)
Your second step is to place all the data (i.e., R objects and any text/data that does not update following code changes) that will make up your table into a matrix. For the table above, I needed a 5x5 matrix. Thus, I input data for all 25 cells, and specified the matrix should have 5 columns only.
tab <- matrix(c(Distract1Mean, Distract1SD, '1 to 7', Distract1min, Distract1max, ActConMean, ActConSD, '1 to 7', ActConmin, ActConmax, ActEnjMean, ActEnjSD, '-6 to 6', ActEnjmin, ActEnjmax, SatisfiedMean, SatisfiedSD, '1 to 7', Satisfiedmin, Satisfiedmax, MoreGratiMean, MoreGratiSD, '1 to 7', MoreGratimin, MoreGratimax), ncol=5, byrow=TRUE)Your third step is to add in the column and row names and to convert the matrix to a dataframe format that the Papaja package can work with.
colnames(tab) <- c('Mean','SD', 'Possible Range', 'Min', 'Max')
rownames(tab) <- c('Distraction','Consumption Amount','Actual-Expected Enjoyment Discrepancy', 'Consumption Satisfaction', 'Need For Further Gratification')
tab <- as.data.frame.matrix(tab)
Your final step is to run the apa_table function of Papaja. All you need to do is specify the dataframe you have just created, provide a table caption and note, specify your alignment preferences for each cell, and make any other formatting preferences (see here for further information). Once these four steps are completed, voila!, you will have created your APA formatted table using Papaja in R Markdown!
apa_table(
  tab, font_size = "footnotesize", caption = "Descriptive summary of key variables.",
  align = c("l", "c", "c", "c", "c", "c"),
  note = "Note here", escape=F
)
Stephen Murphy
Postdoctoral Research Fellow in Psychology
My research interests include self-regulation, motivation, meta-science, data science, and digital wellbeing.